What is an algorithm?
An algorithm is a set of step-by-step instructions which can be followed to accomplish a goal or solve a problem. A cooking recipe can be an algorithm, just like directions to the hospital. Most of the time, however, we refer to computer algorithms. These are pieces of computer code aimed at solving specific problems. You insert data, the computer algorithm performs calculations based on this data, and gives you an output; the solution to the problem. In the context of radiology, an algorithm is usually a piece of computer code that takes a medical image as input and returns an answer to help the radiologist with his/her analysis.
What is (training) data?
To build an algorithm you (almost) always need a dataset, the training data, to get started. This dataset will be a batch of the type of data you want your algorithm to analyze. In radiology, this would be image data. Depending on the type of algorithm used, you may need additional information as well. This may be information on what you see in the image (e.g. a segmentation) or other patient information.

What is a label?
For most algorithms you need a labeled dataset. This means that for every data point in your dataset (in radiology, for every image) you know the ground truth: the label. For example, if you want to build an algorithm that is able to differentiate between malign and benign tumors, the medical images in your dataset need to contain tumors and every image needs to have a label “benign” or “malign”. This will help the computer to learn how different tumor types can be recognized on the images

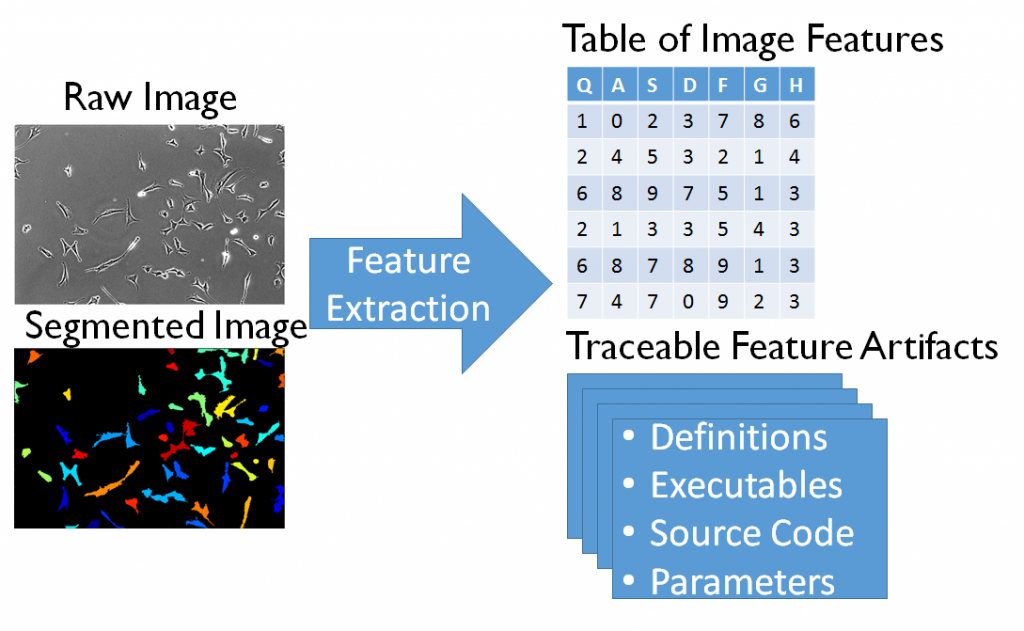
What is an image feature?
An image feature is a measurable characteristic or a specific property that you can find in each image of the training data. For example, if your input data is a set of x-ray images of the hip, image features may include the shape of the patient’s femoral head, but it may also be more abstract such as the distribution of gray-scale values within the femoral head.
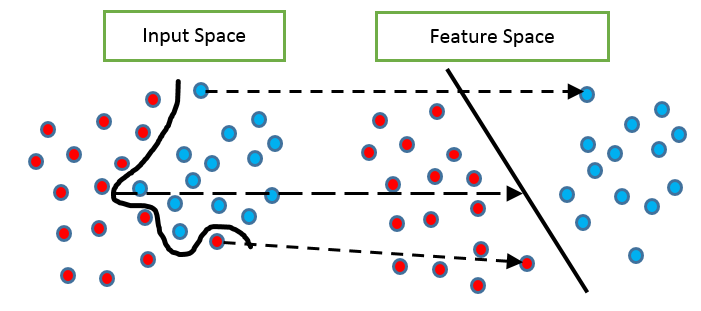
What is a feature space?
All features combined can be represented in feature space. A visual representation of feature space (showing features in a graph) can help to get an overview of all feature values. The simplest example is when your dataset has two features. You visualize this by drawing a graph with one feature on the x-axis and the other feature on the y_axis. Each image can be represented in this graph by drawing a point at location (X,Y) with X being the image’s value for the first feature and Y the image’s value for the second feature. Analyzing data in (the right) feature space makes it easier to discover correlations which are not apparent when looking at the original data.